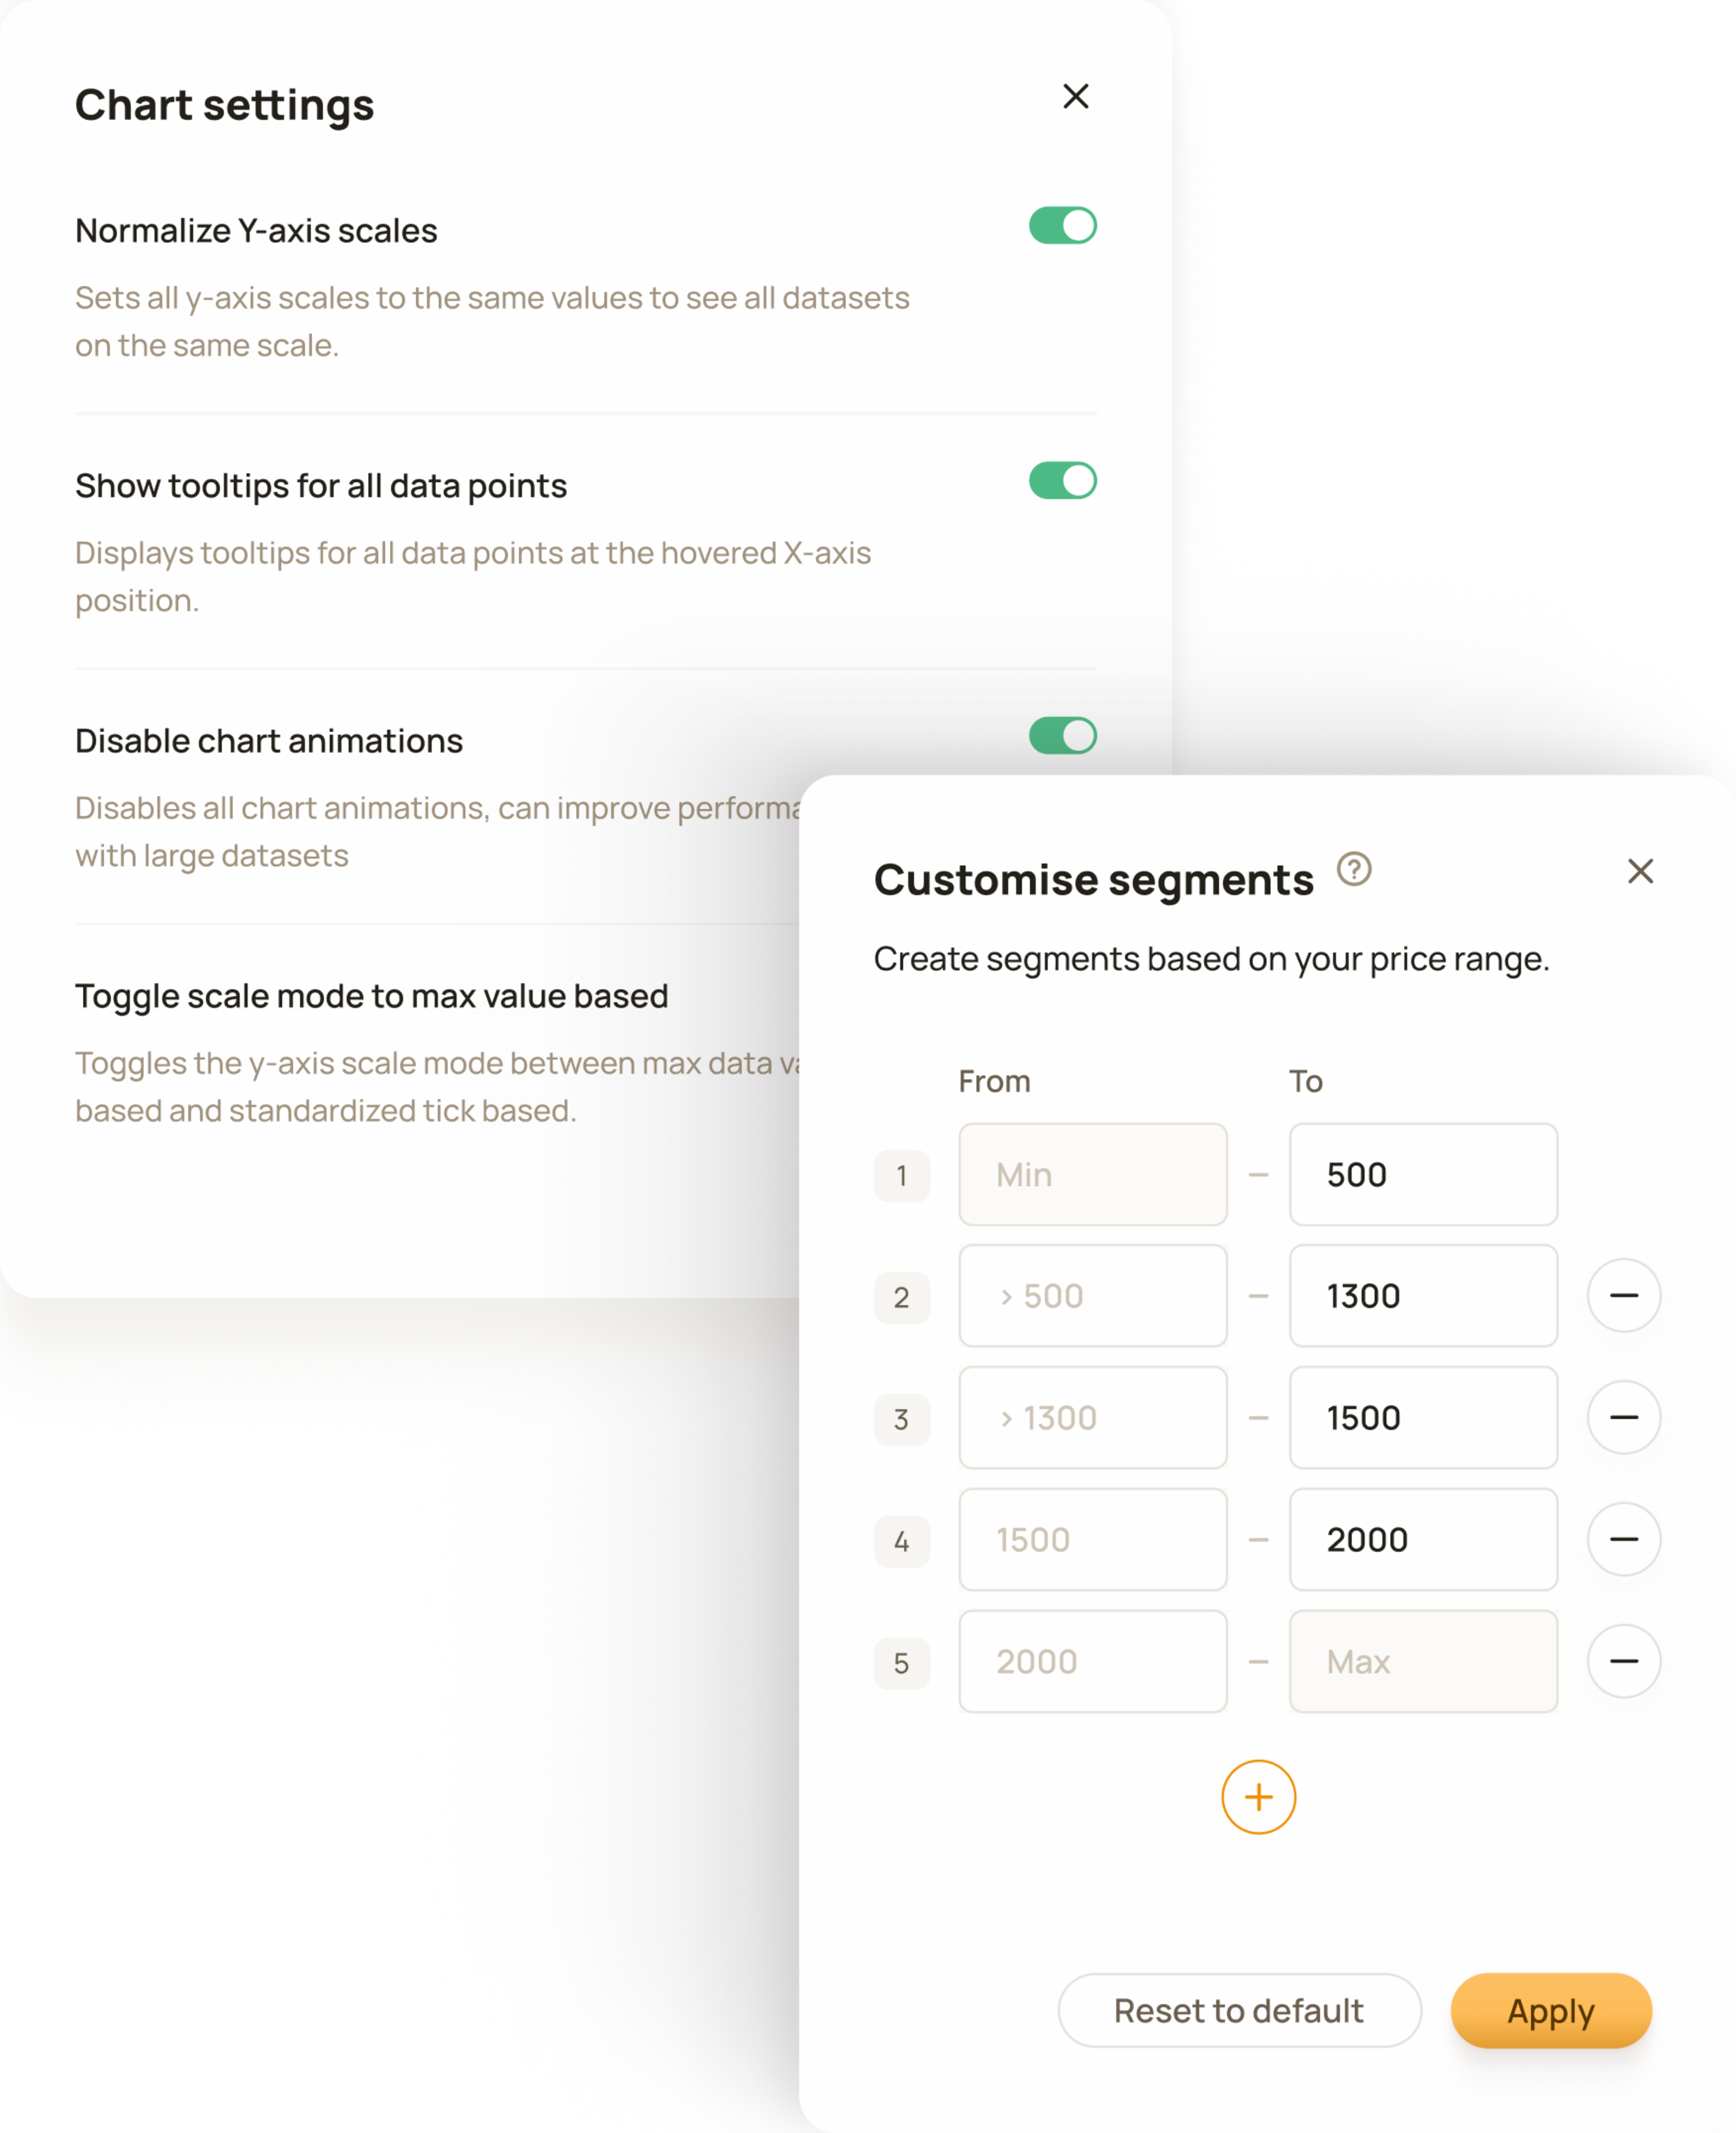
The tool includes many detail configuration settings allowing users to adjust the tool based on their unique data and personal preferences.
B2B / SaaS / Web App
Priceindx
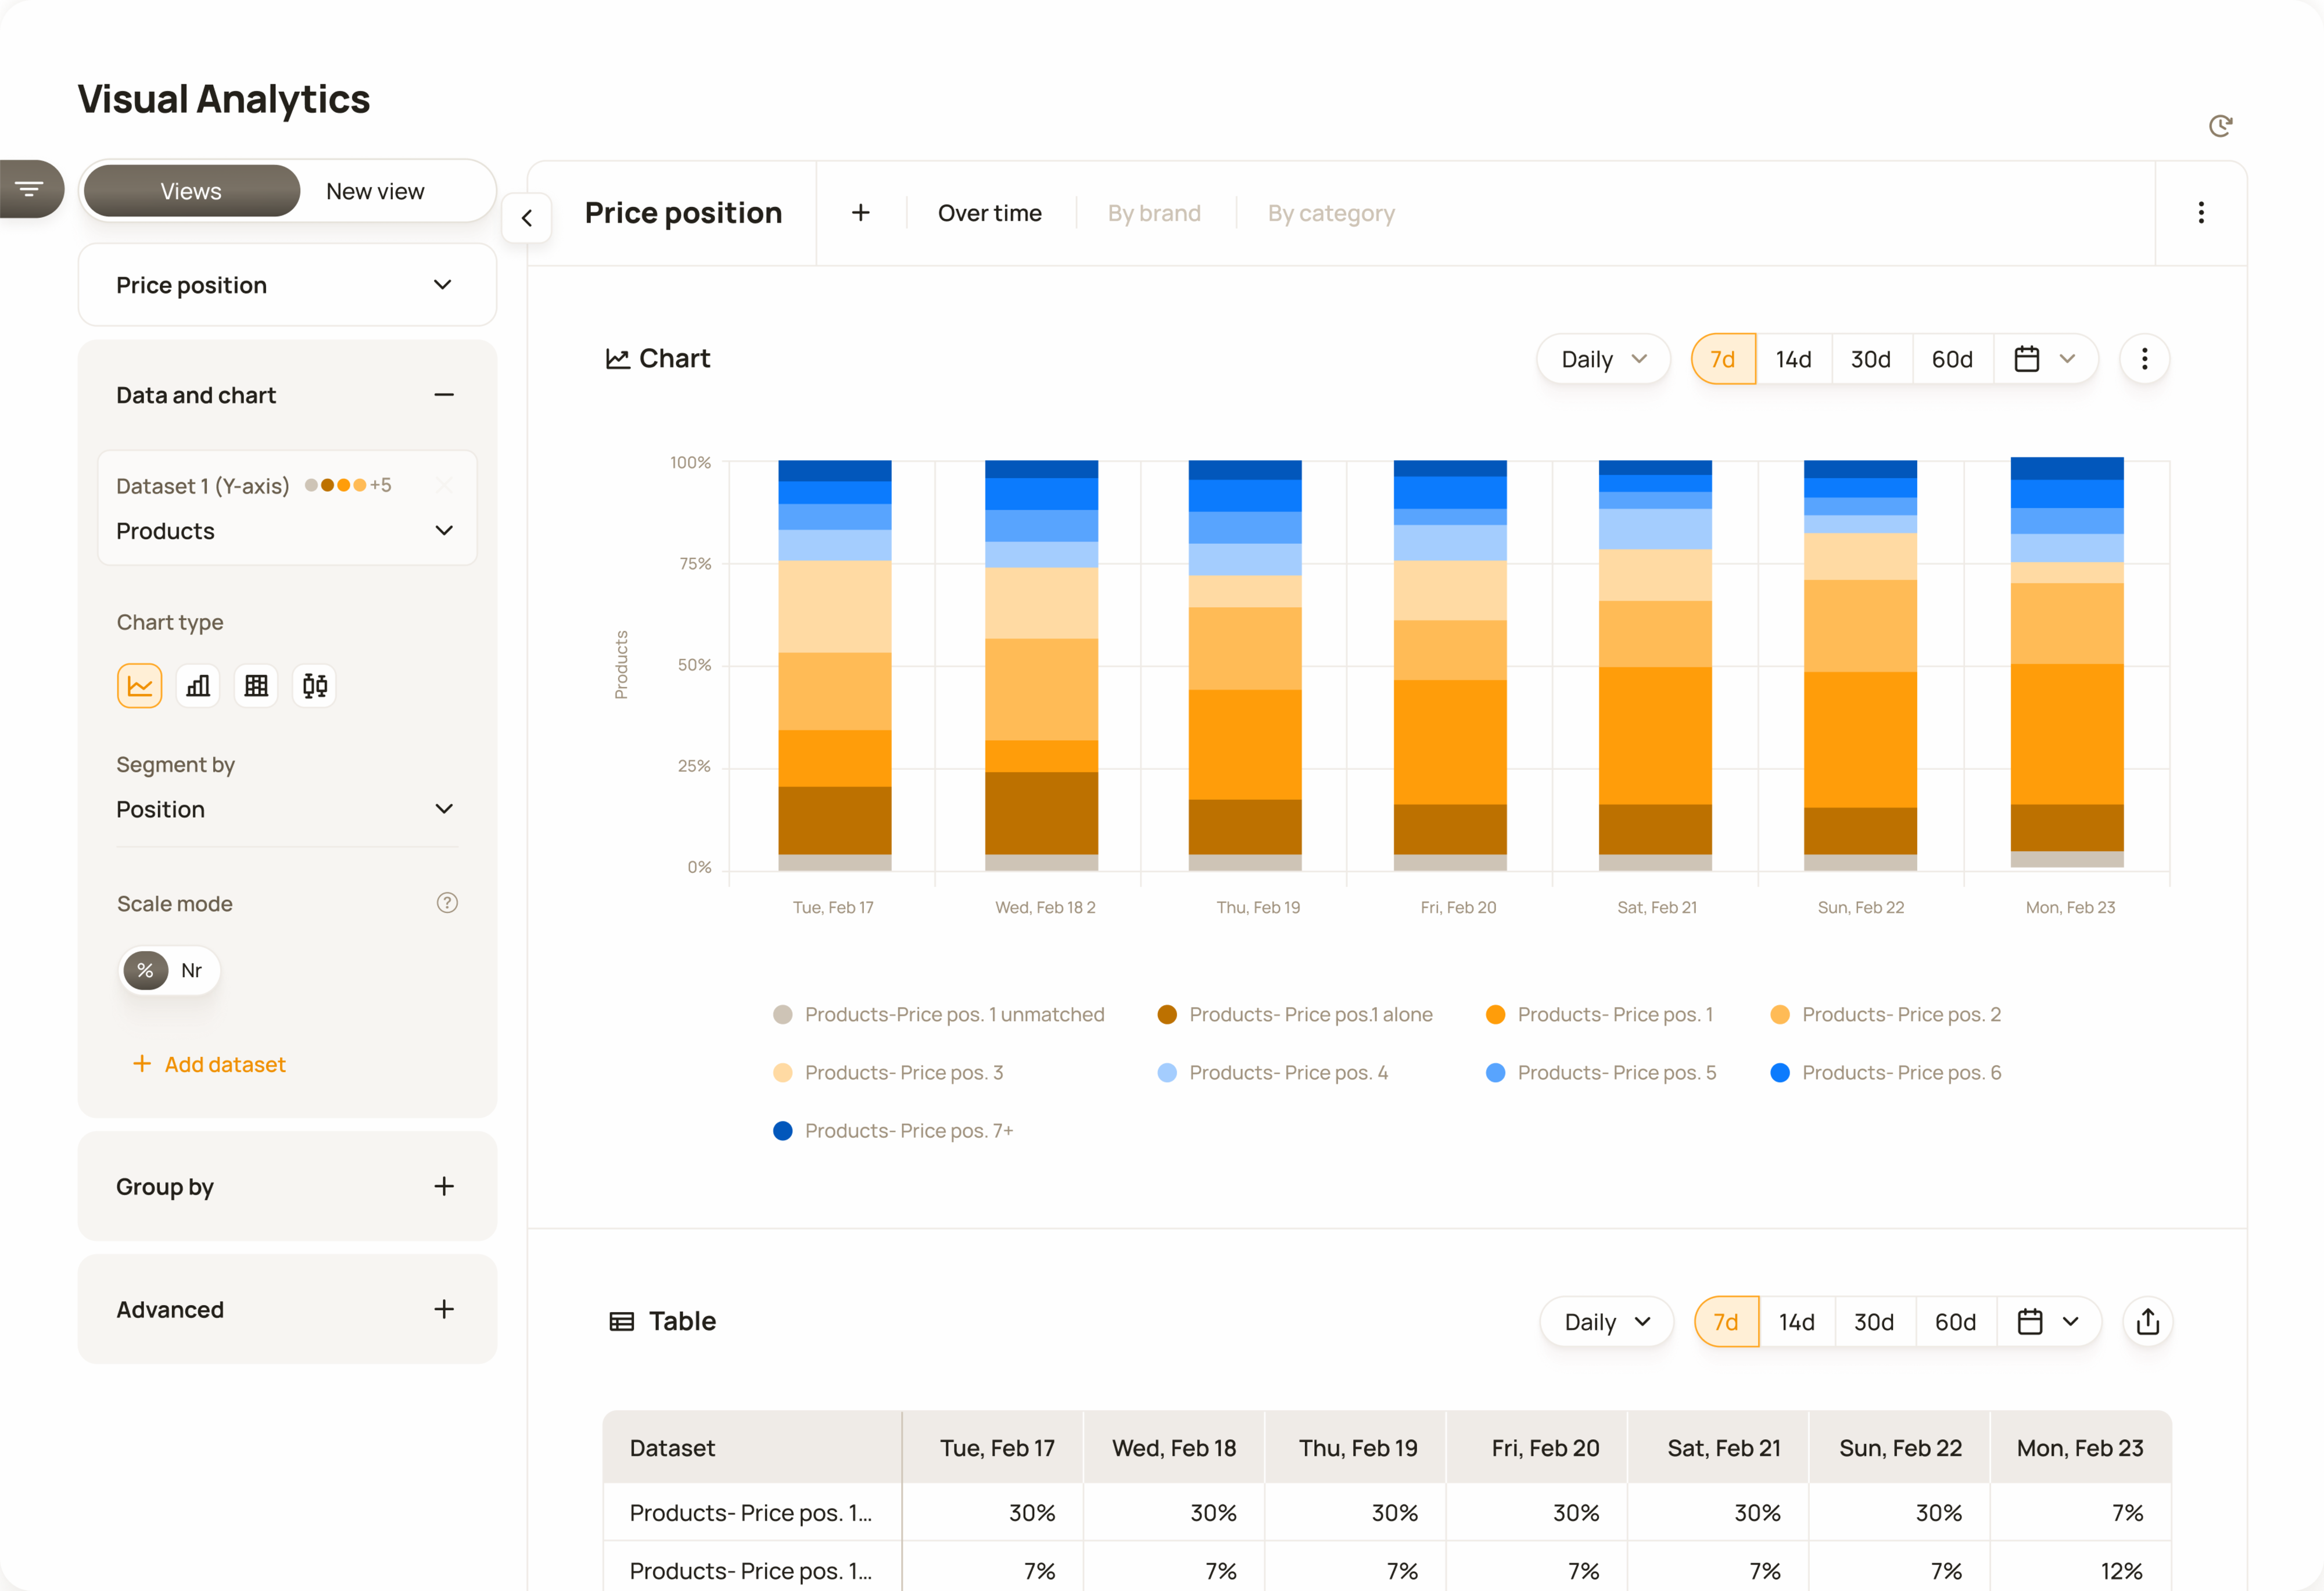
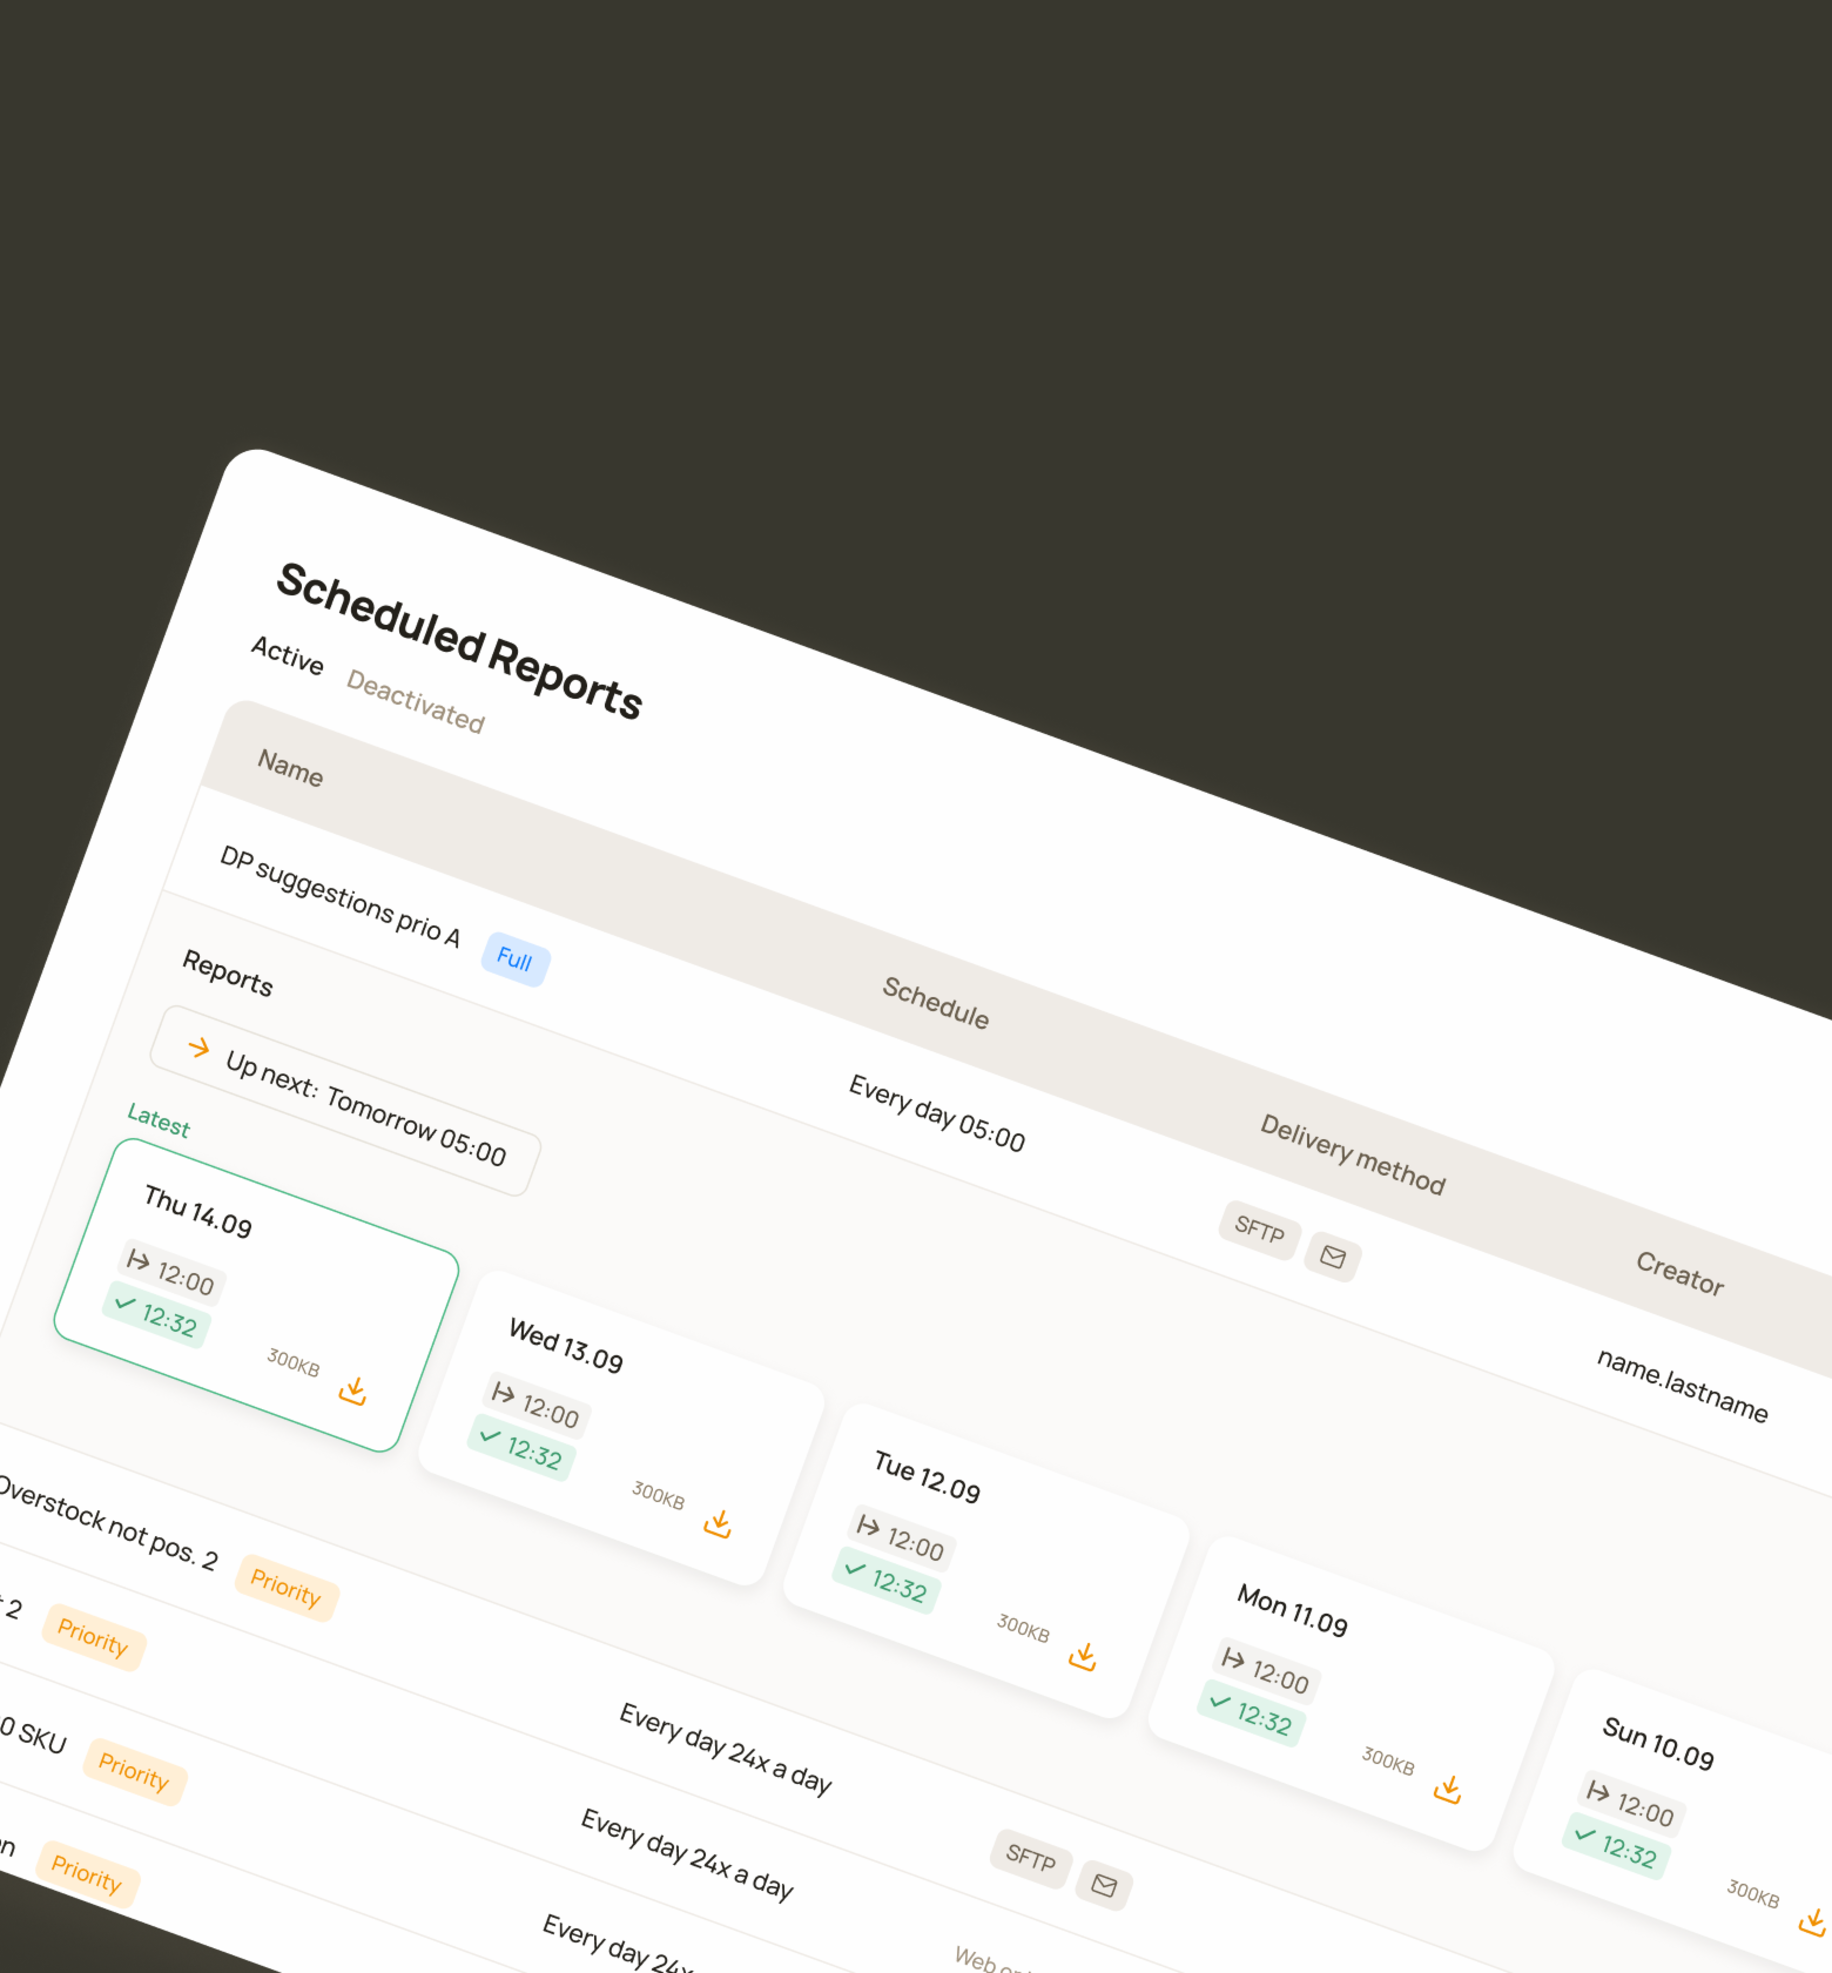
The main selection is in the top left, where users can view presets or create new views. The chart is configured in the left panel, time settings are controlled at the top.
The Visual Analytics tool was driven by both customer demand and a strategic business decision to unlock the potential of aggregated, high-level data and gain a competitive advantage.
Priceindx was founded in 2006 in Sweden and was the first company in its field in Europe. Gathering and processing large amounts of competitor data has been at the core of the service Priceindx has provided to retailers and brands ever since. Customers access this data through data presentation and data visualisation tools on the web platform.
Customers primarily had access to product-level data, which they used for operational purposes, but they expressed a need for aggregated, visualized data to support more strategic analysis.
Research for this project consisted of two main parts: identifying customer needs and developing a deep understanding of the domain of data aggregation and visualisation. It was the longest and most in-depth research I had conducted up to that point.
Customers requested specific charts and graphs, such as margin by category, price position by brand, or price changes compared to competitors.
To better understand the true nature of the problem, I investigated further to uncover the underlying needs behind these requests through discussions with the customer success team. These requests represented a high-level specialist’s need for different types of data that would allow them to think strategically and make long-term decisions.
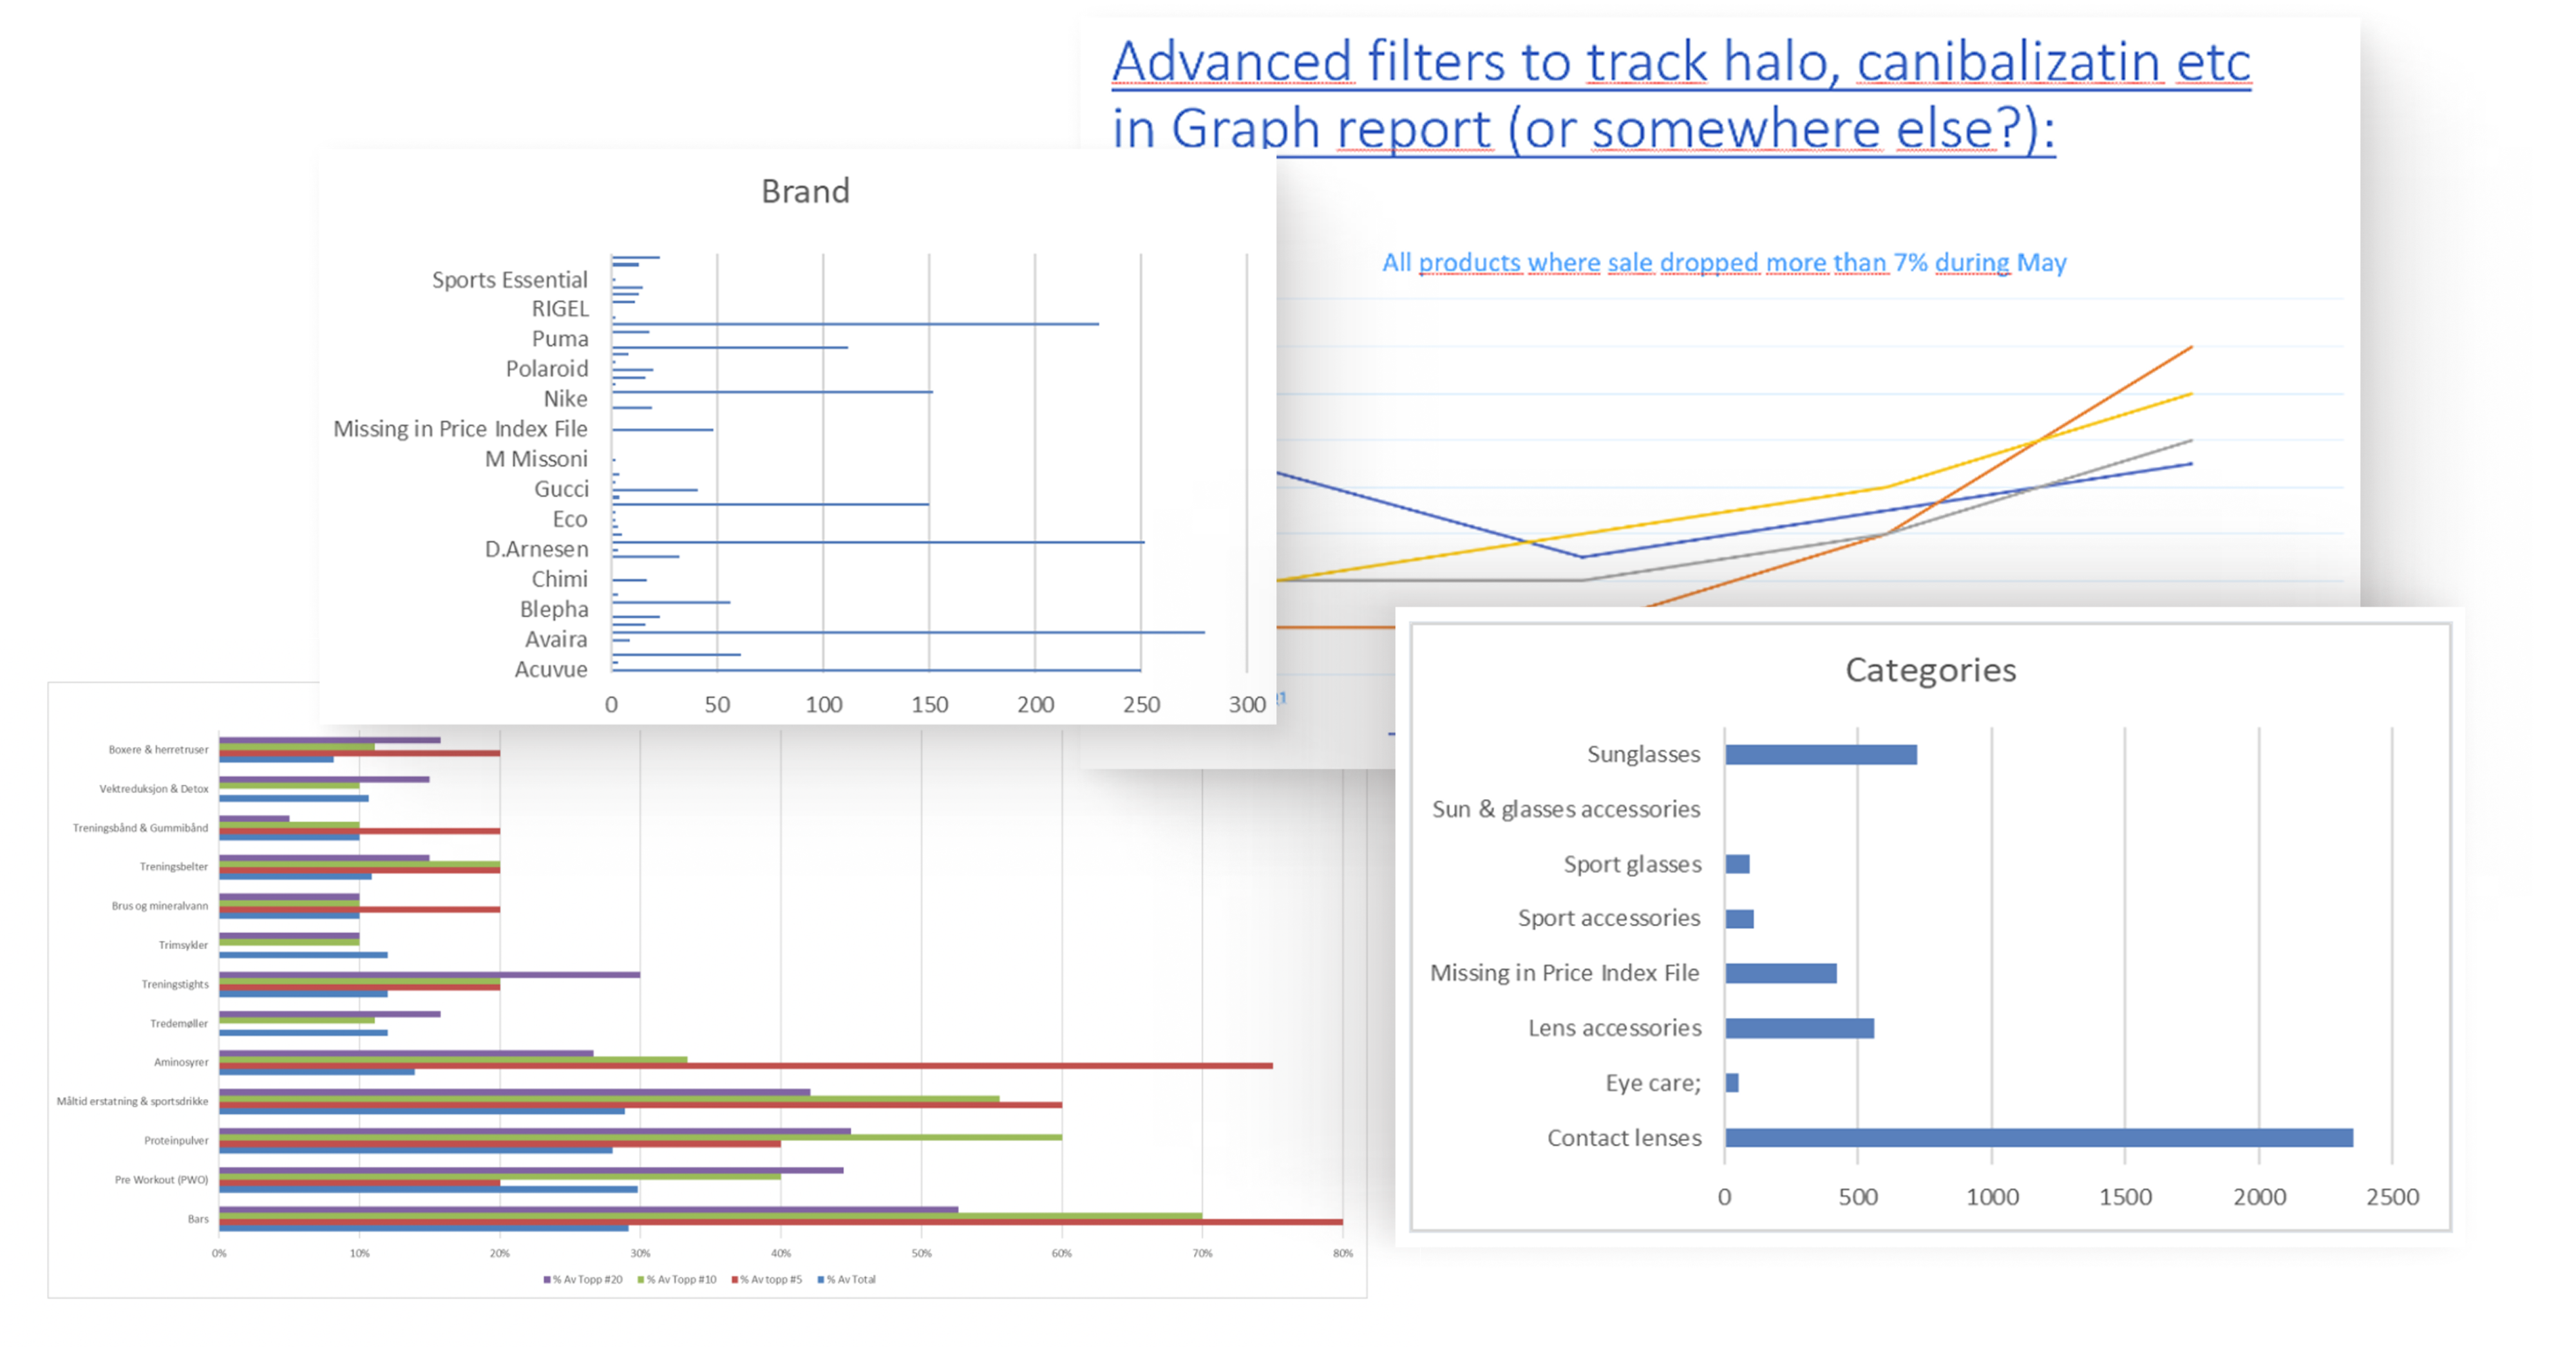
Some examples of chart and graph ideas requested by customers
I mapped aggregation and visualisation together to understand which data types could be meaningfully represented with which visualisation methods.
I started the domain research by focusing on data aggregation: its purpose, principles, and common standards, as this is the basis for the visualisation. Then, I explored data visualisation by reviewing various chart and graph types, the kinds of data they support, and the types of insights each visualisation is best suited to communicate.
Additionally, I conducted competitor research in this domain to understand how similar tools were structured, what kind of functionality they offered, and how similar problems were typically solved. This helped establish a clearer understanding of the solution space and what we were ultimately trying to build.
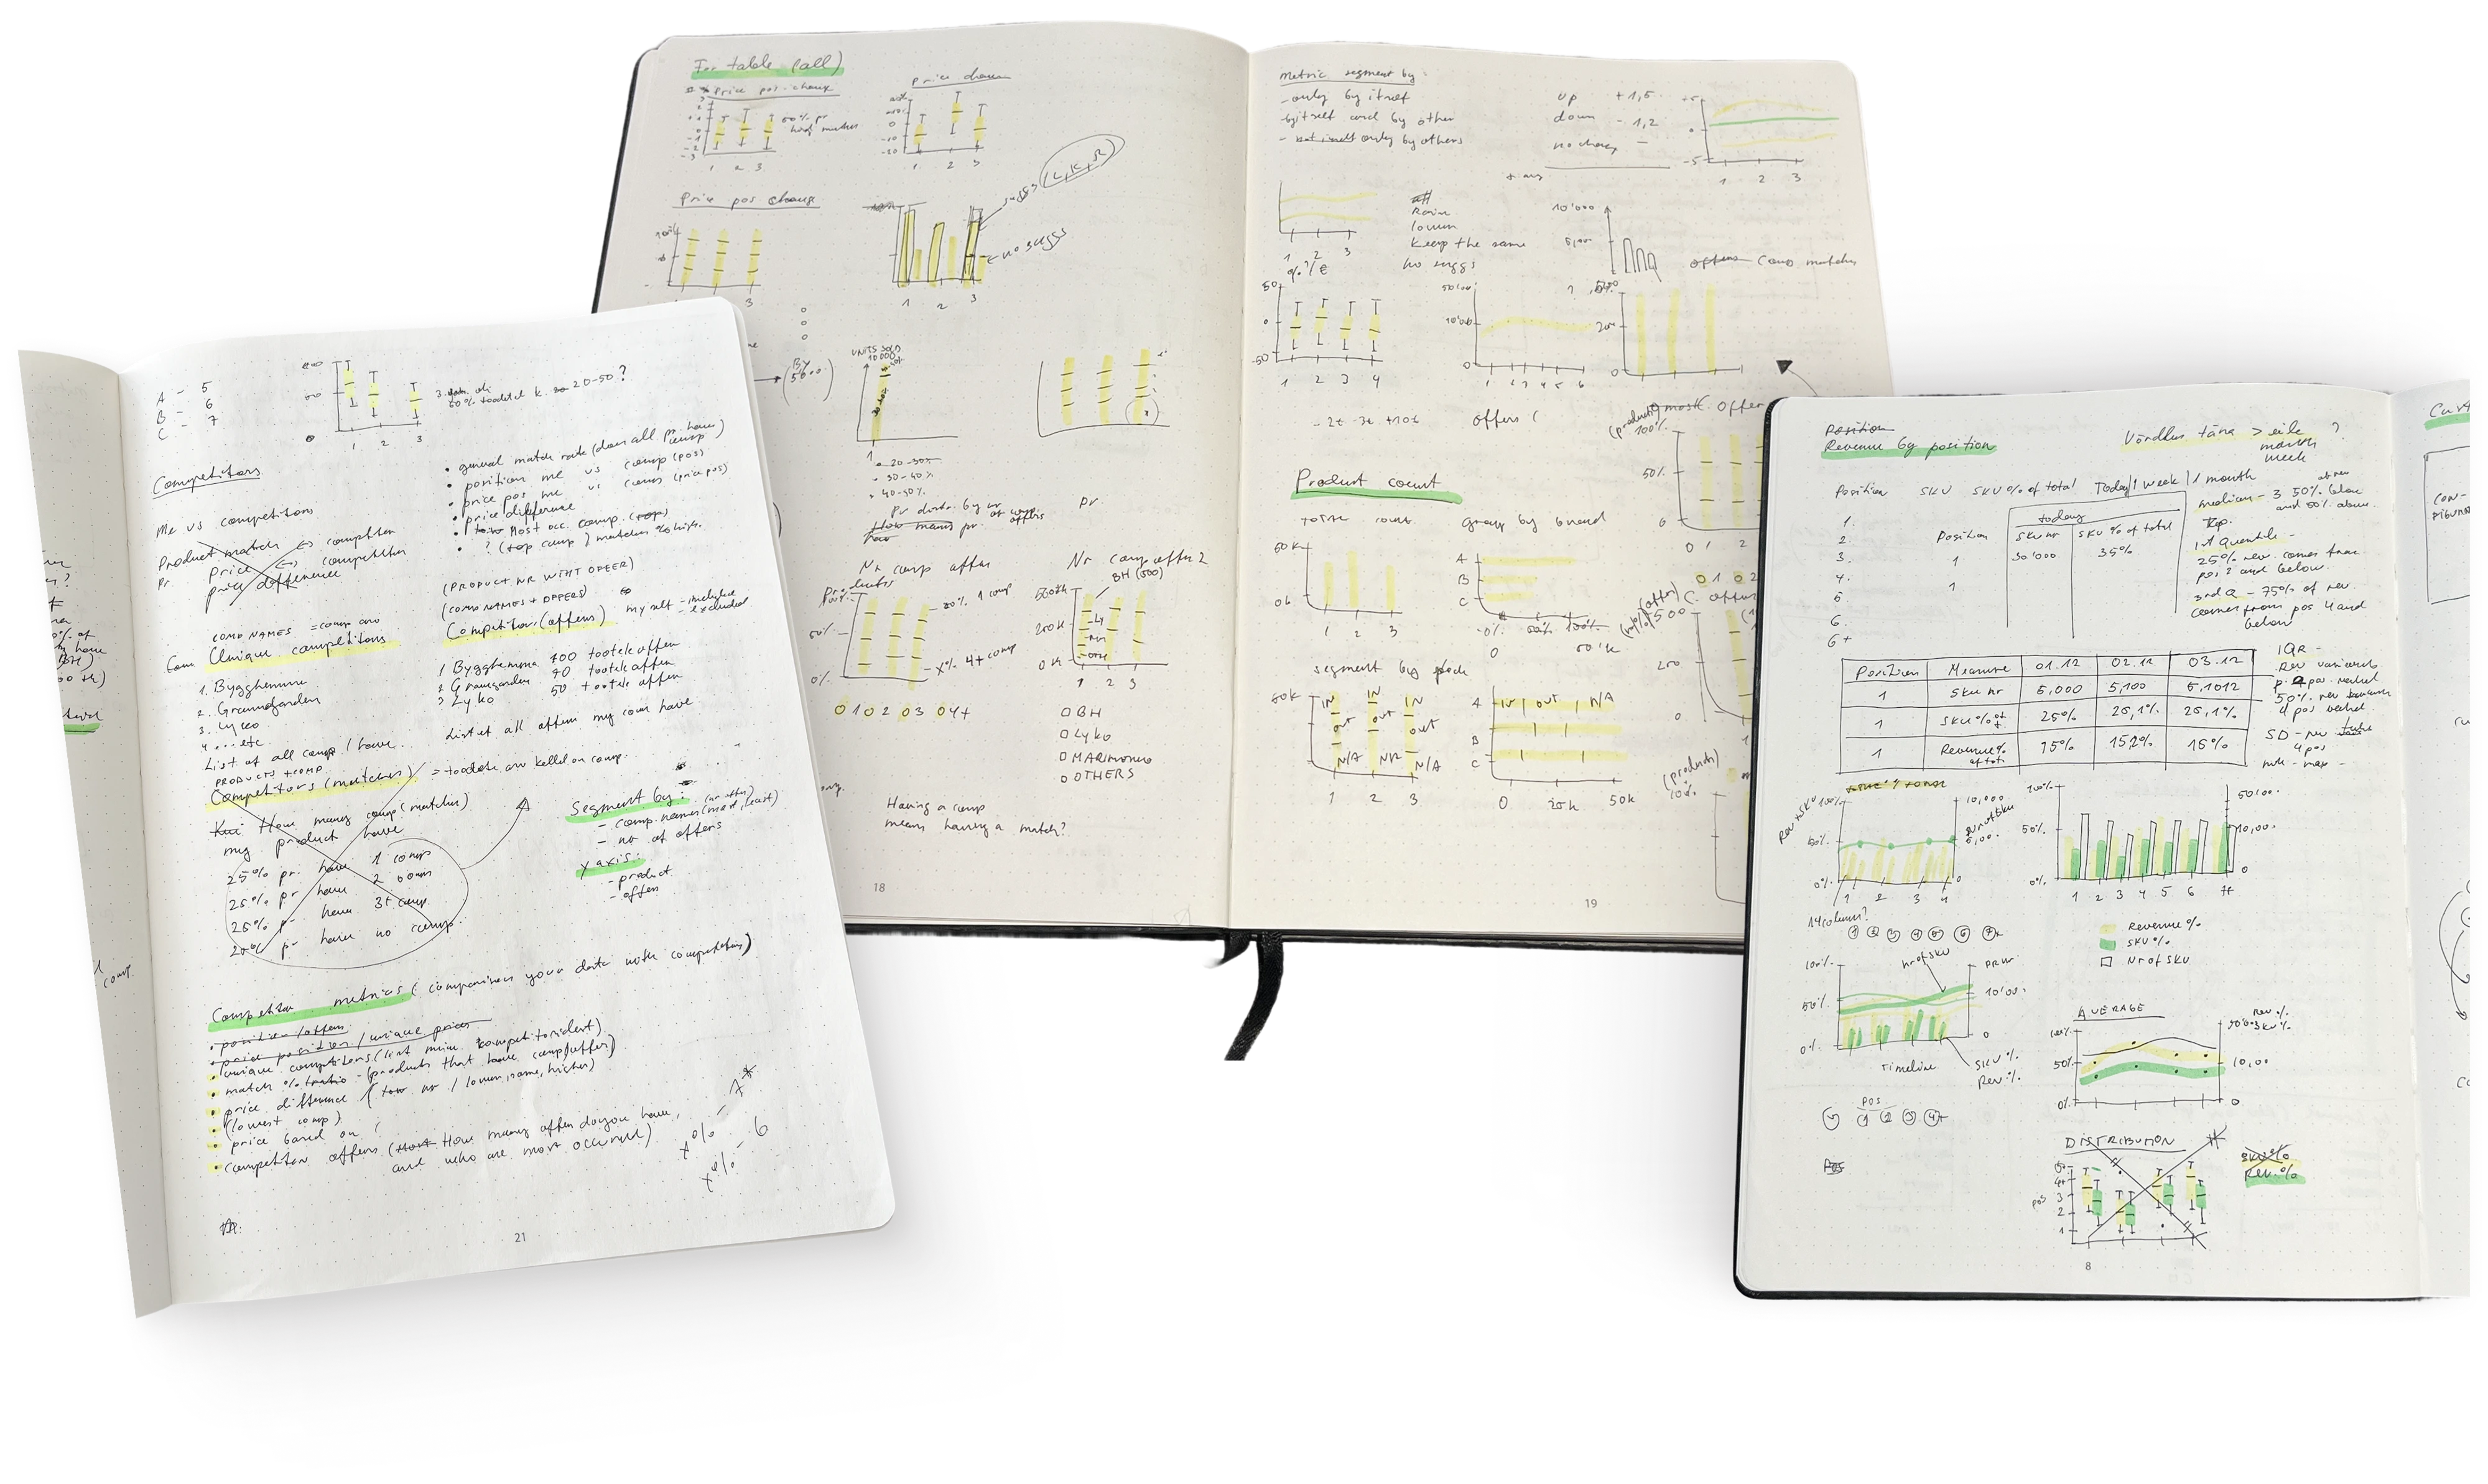
This is what one part of my research looked like on paper: testing theories by trying everything within our data context.
Ideation focused on aligning information from user and domain research with the data and system capabilities to formulate a solid concept. Early sketches were created to define core functionality, interface structure, and key visualization options.
The next step was to align all information from research with our existing data, evaluating what was necessary, feasible, and realistically possible given our system constraints.
The solution gradually started to take shape. We came to understand that the core functionality was allowing users to create charts and graphs themselves. We defined the general interface structure, included data, aggregation types, and chart types.
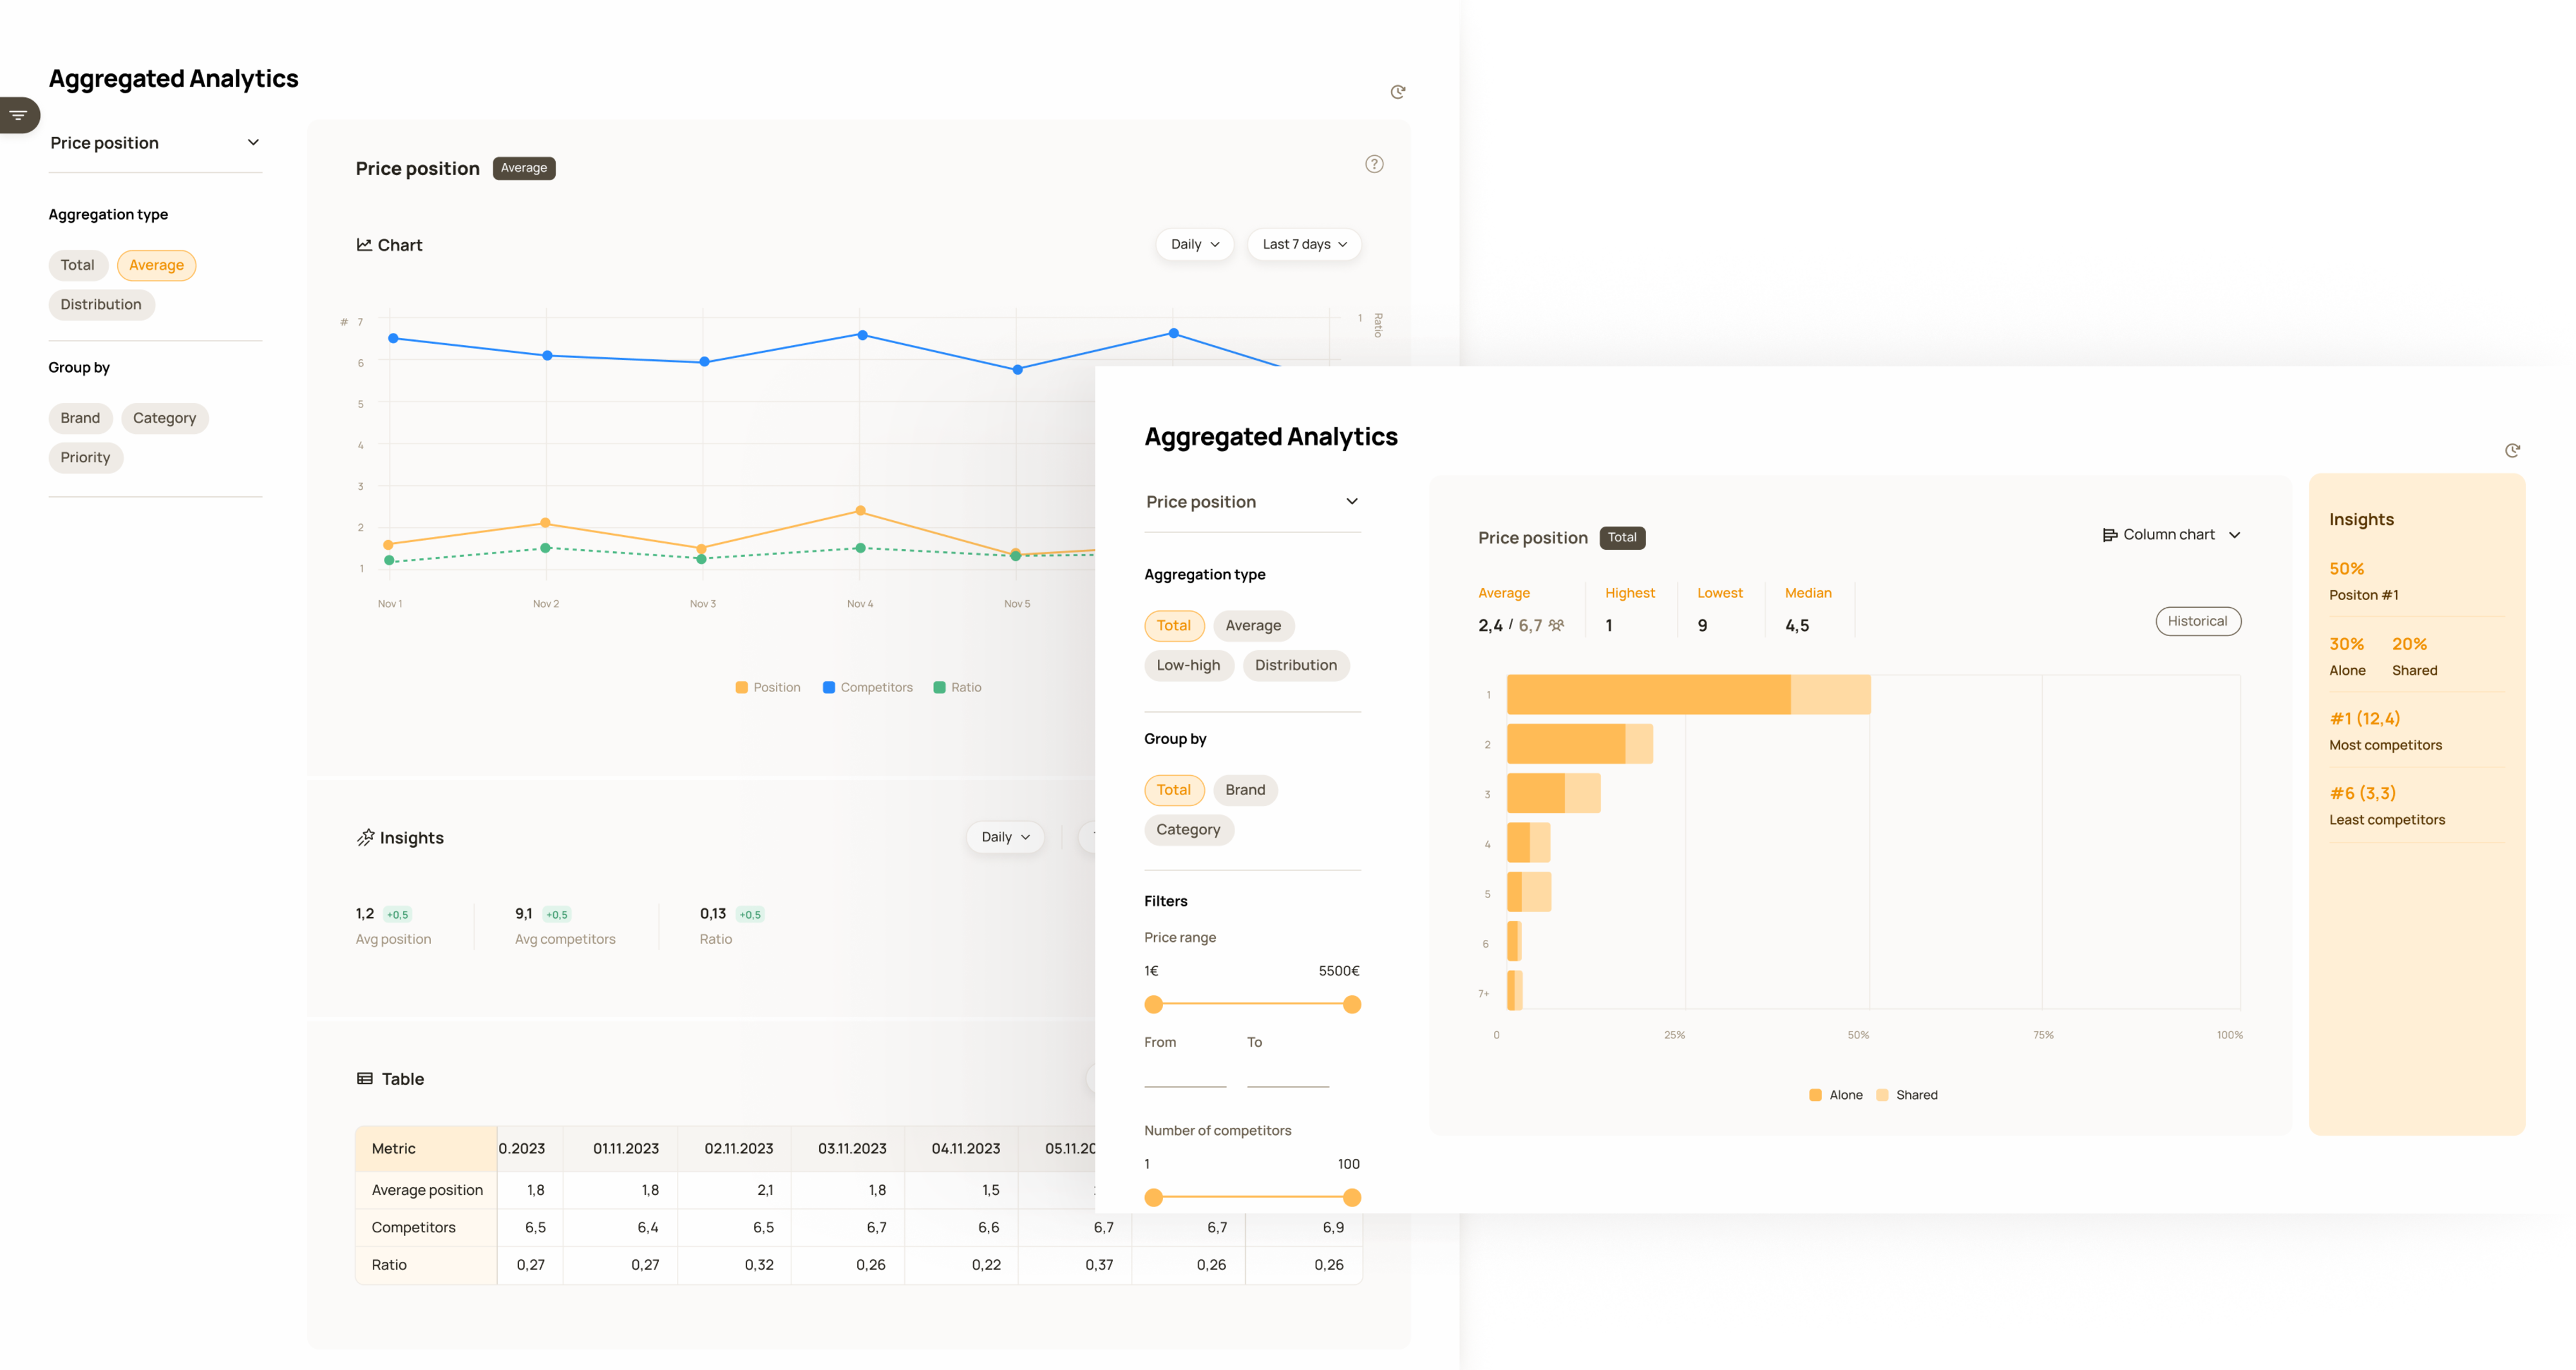
Early sketches of the tool included the idea of adding an “Insights” section, but it had too many constraints at the time, so it was left out of the version we launched.
We decided to create a data visualization tool that provides a high-level overview of trends and patterns, with the ability to drill down into product-level information for deeper analysis.
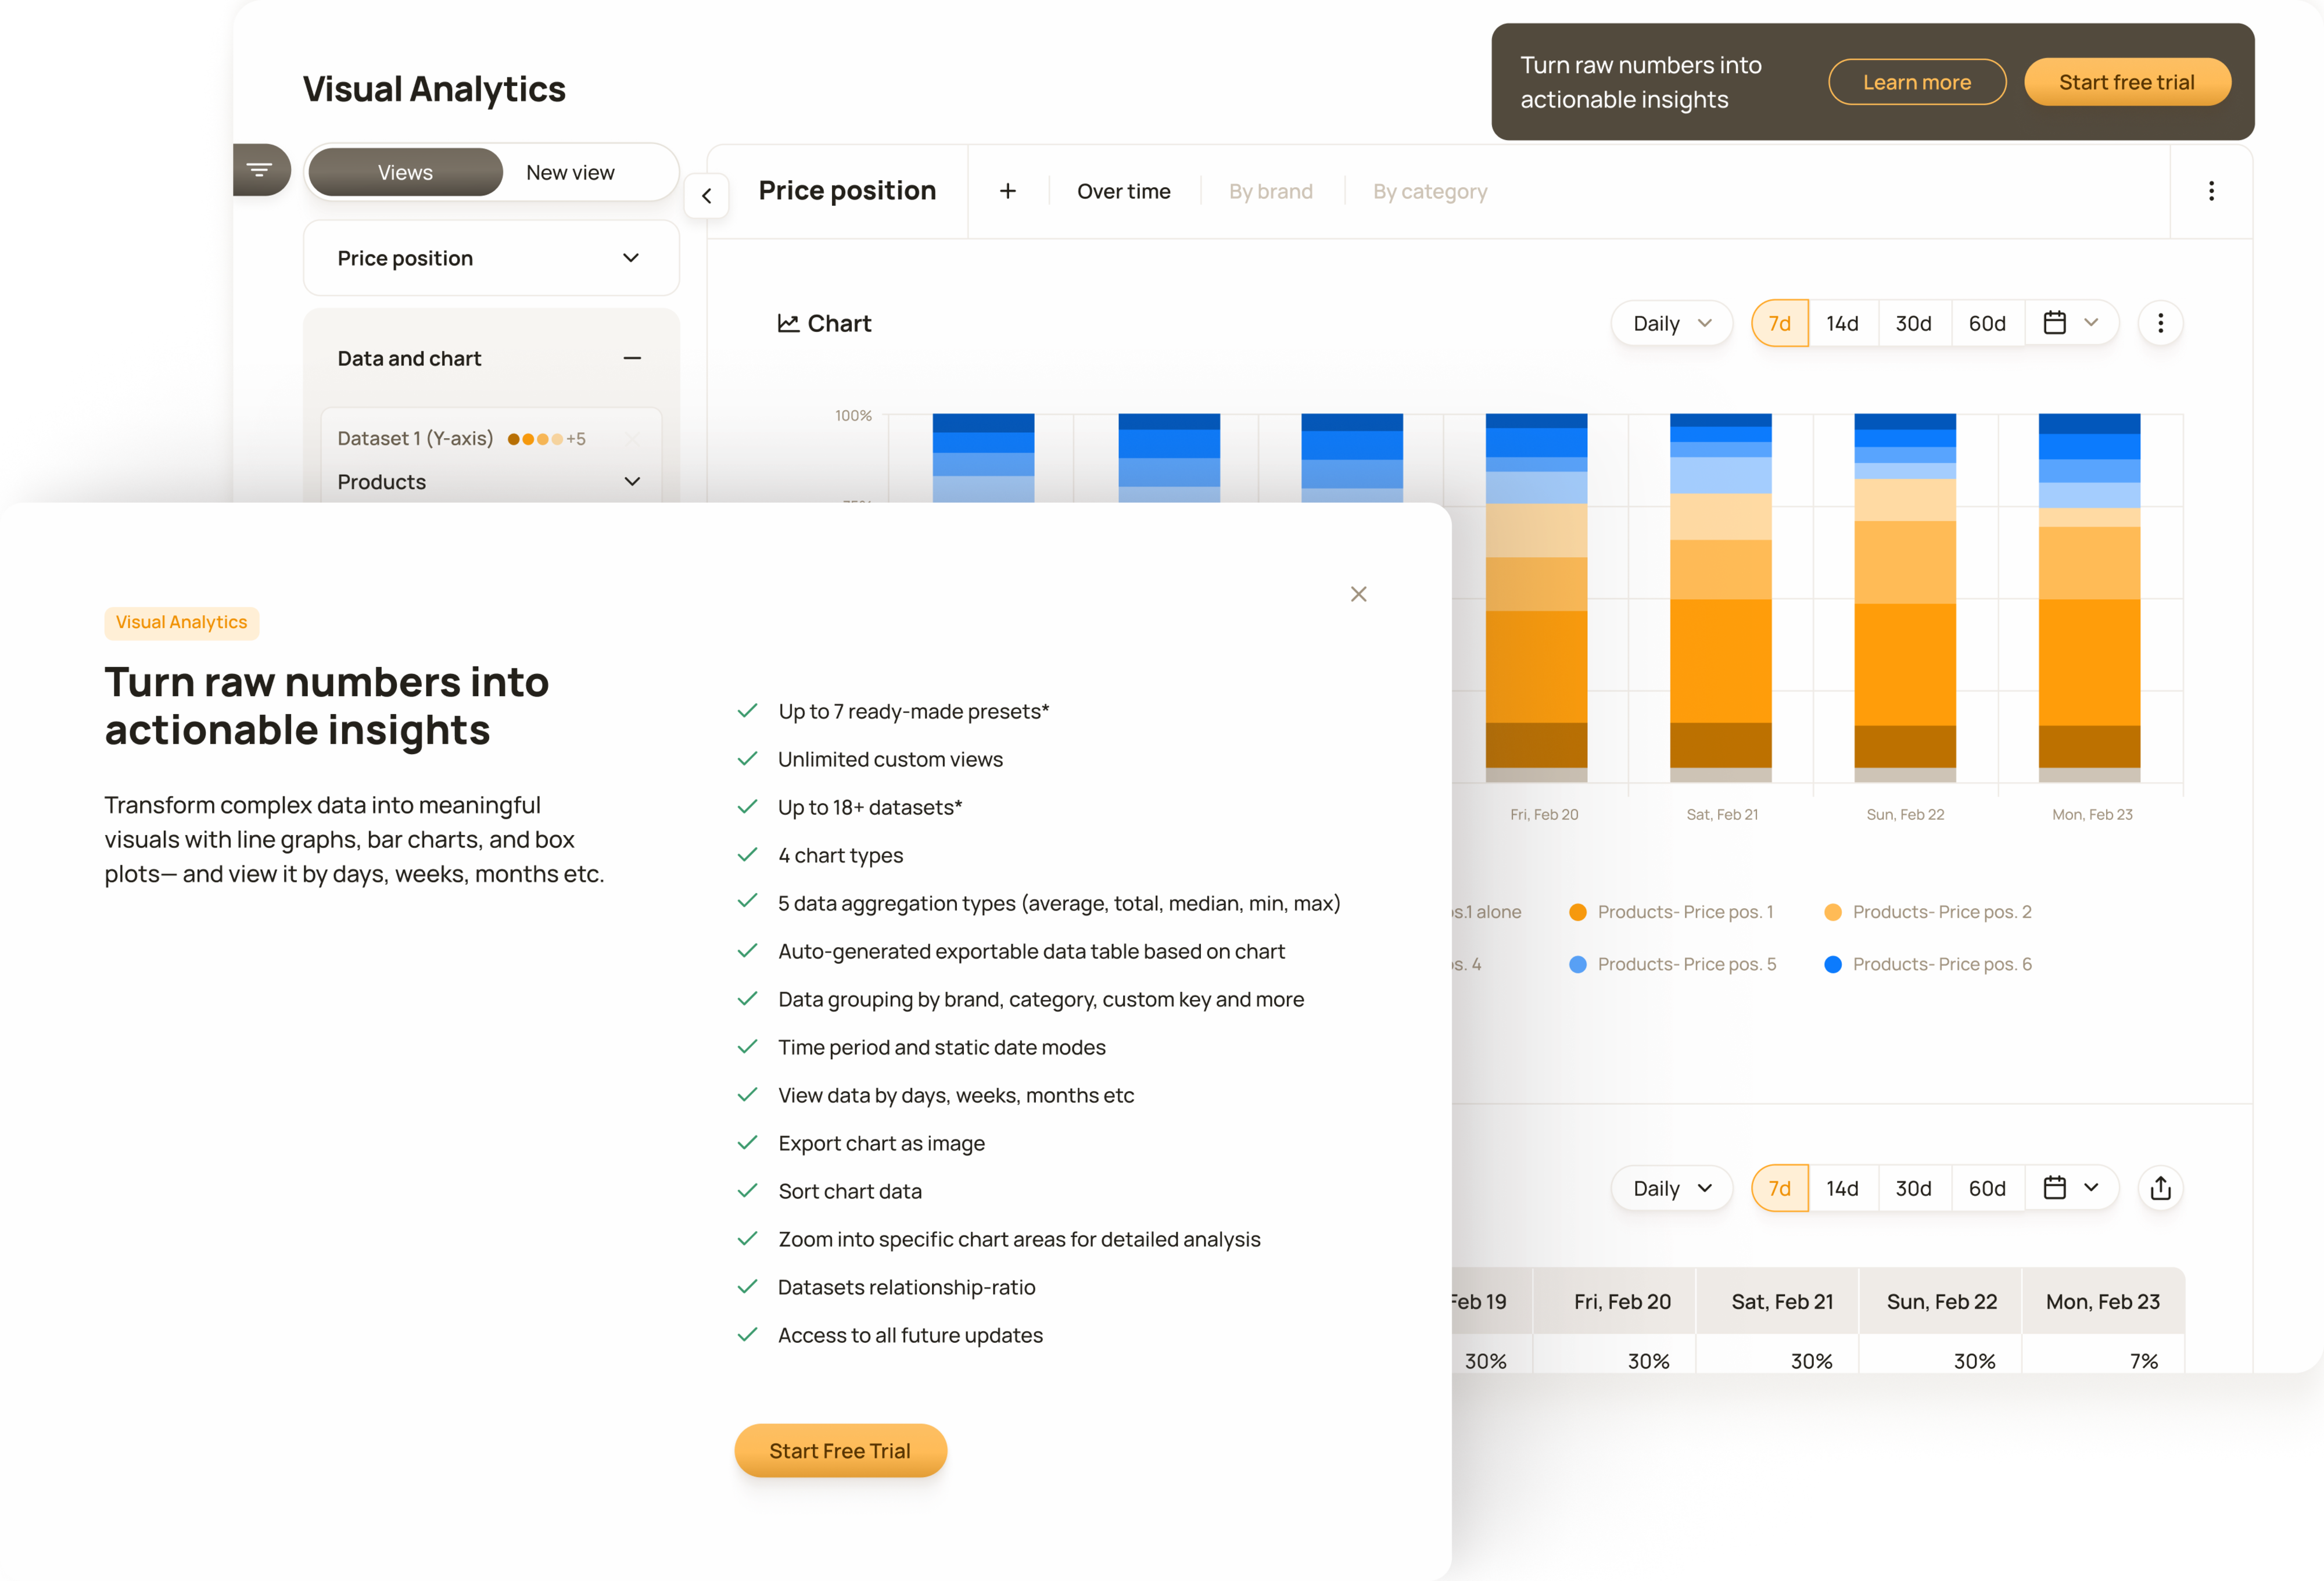
An upgrade prompt shown to customers without a Visual Analytics subscription. The 'Learn more' button opens a modal explaining the feature and its capabilities.
In reality, ideation and execution overlapped due to new discoveries, unexpected challenges, and evolving constraints. Design decisions were continuously refined based on technical feasibility, stakeholder input, and emerging user needs.
The most time consuming and full of constraints part was defining the underlying systems and logic of the feature.
Not every dataset works with every aggregation type. The type of data defines which chart types are meaningful and even possible, and combining multiple datasets increases complexity significantly. All possible combinations had to be carefully specified on the backend to prevent illogical or unsupported configurations.
The tool includes many detail configuration settings allowing users to adjust the tool based on their unique data and personal preferences.
We used the same approach as in the Table project: designing it based on the largest customer database.
We tried to optimise performance according to the design, rather than shaping the design around performance. This was driven by users’ mental models in this particular context and their expectations that certain things should work in a certain way. In this case, we used per-filter live fetching instead of batch filtering from the main action bar, allowing changes such as dataset selection and chart type to update the chart dynamically.

Different colour logic is used depending on the data structure: sequential ranges, categorical values, conditional states, or diverging comparisons.

Although the feature includes built-in colour logic based on the nature of the data, users can customise chart colours if needed.
We followed a testing approach that we used to validate Table - unmoderated testing with six customers, including enterprise clients, on full version of the product.
Testing confirmed our early hypothesis that the usefulness of the tool would highly depend on the way customers used the rest of our product.
During testing, it became clear that the tool provided the most value to customers who used our other functionality to the fullest extent, as this generated useful datasets that could be freely combined and compared. Naturally, its value was greatest for customers with the widest range of datasets and the longest client history, which provided the most historic data for identifying trends and insights.
The result of the testing phase was thus a mixed bag that matched our expectations - the customers that used a more lean version of our product found considerably less value in it than the larger and more established enterprise customers.
In addition to iterations on the core functionality, I saw a need for extra refinements to avoid any loose ends before launch, catch edge cases, and define the need for help and guidance.
I created an internal audit based on usability heuristics to cover potential edge cases and define system behaviour when something goes wrong.
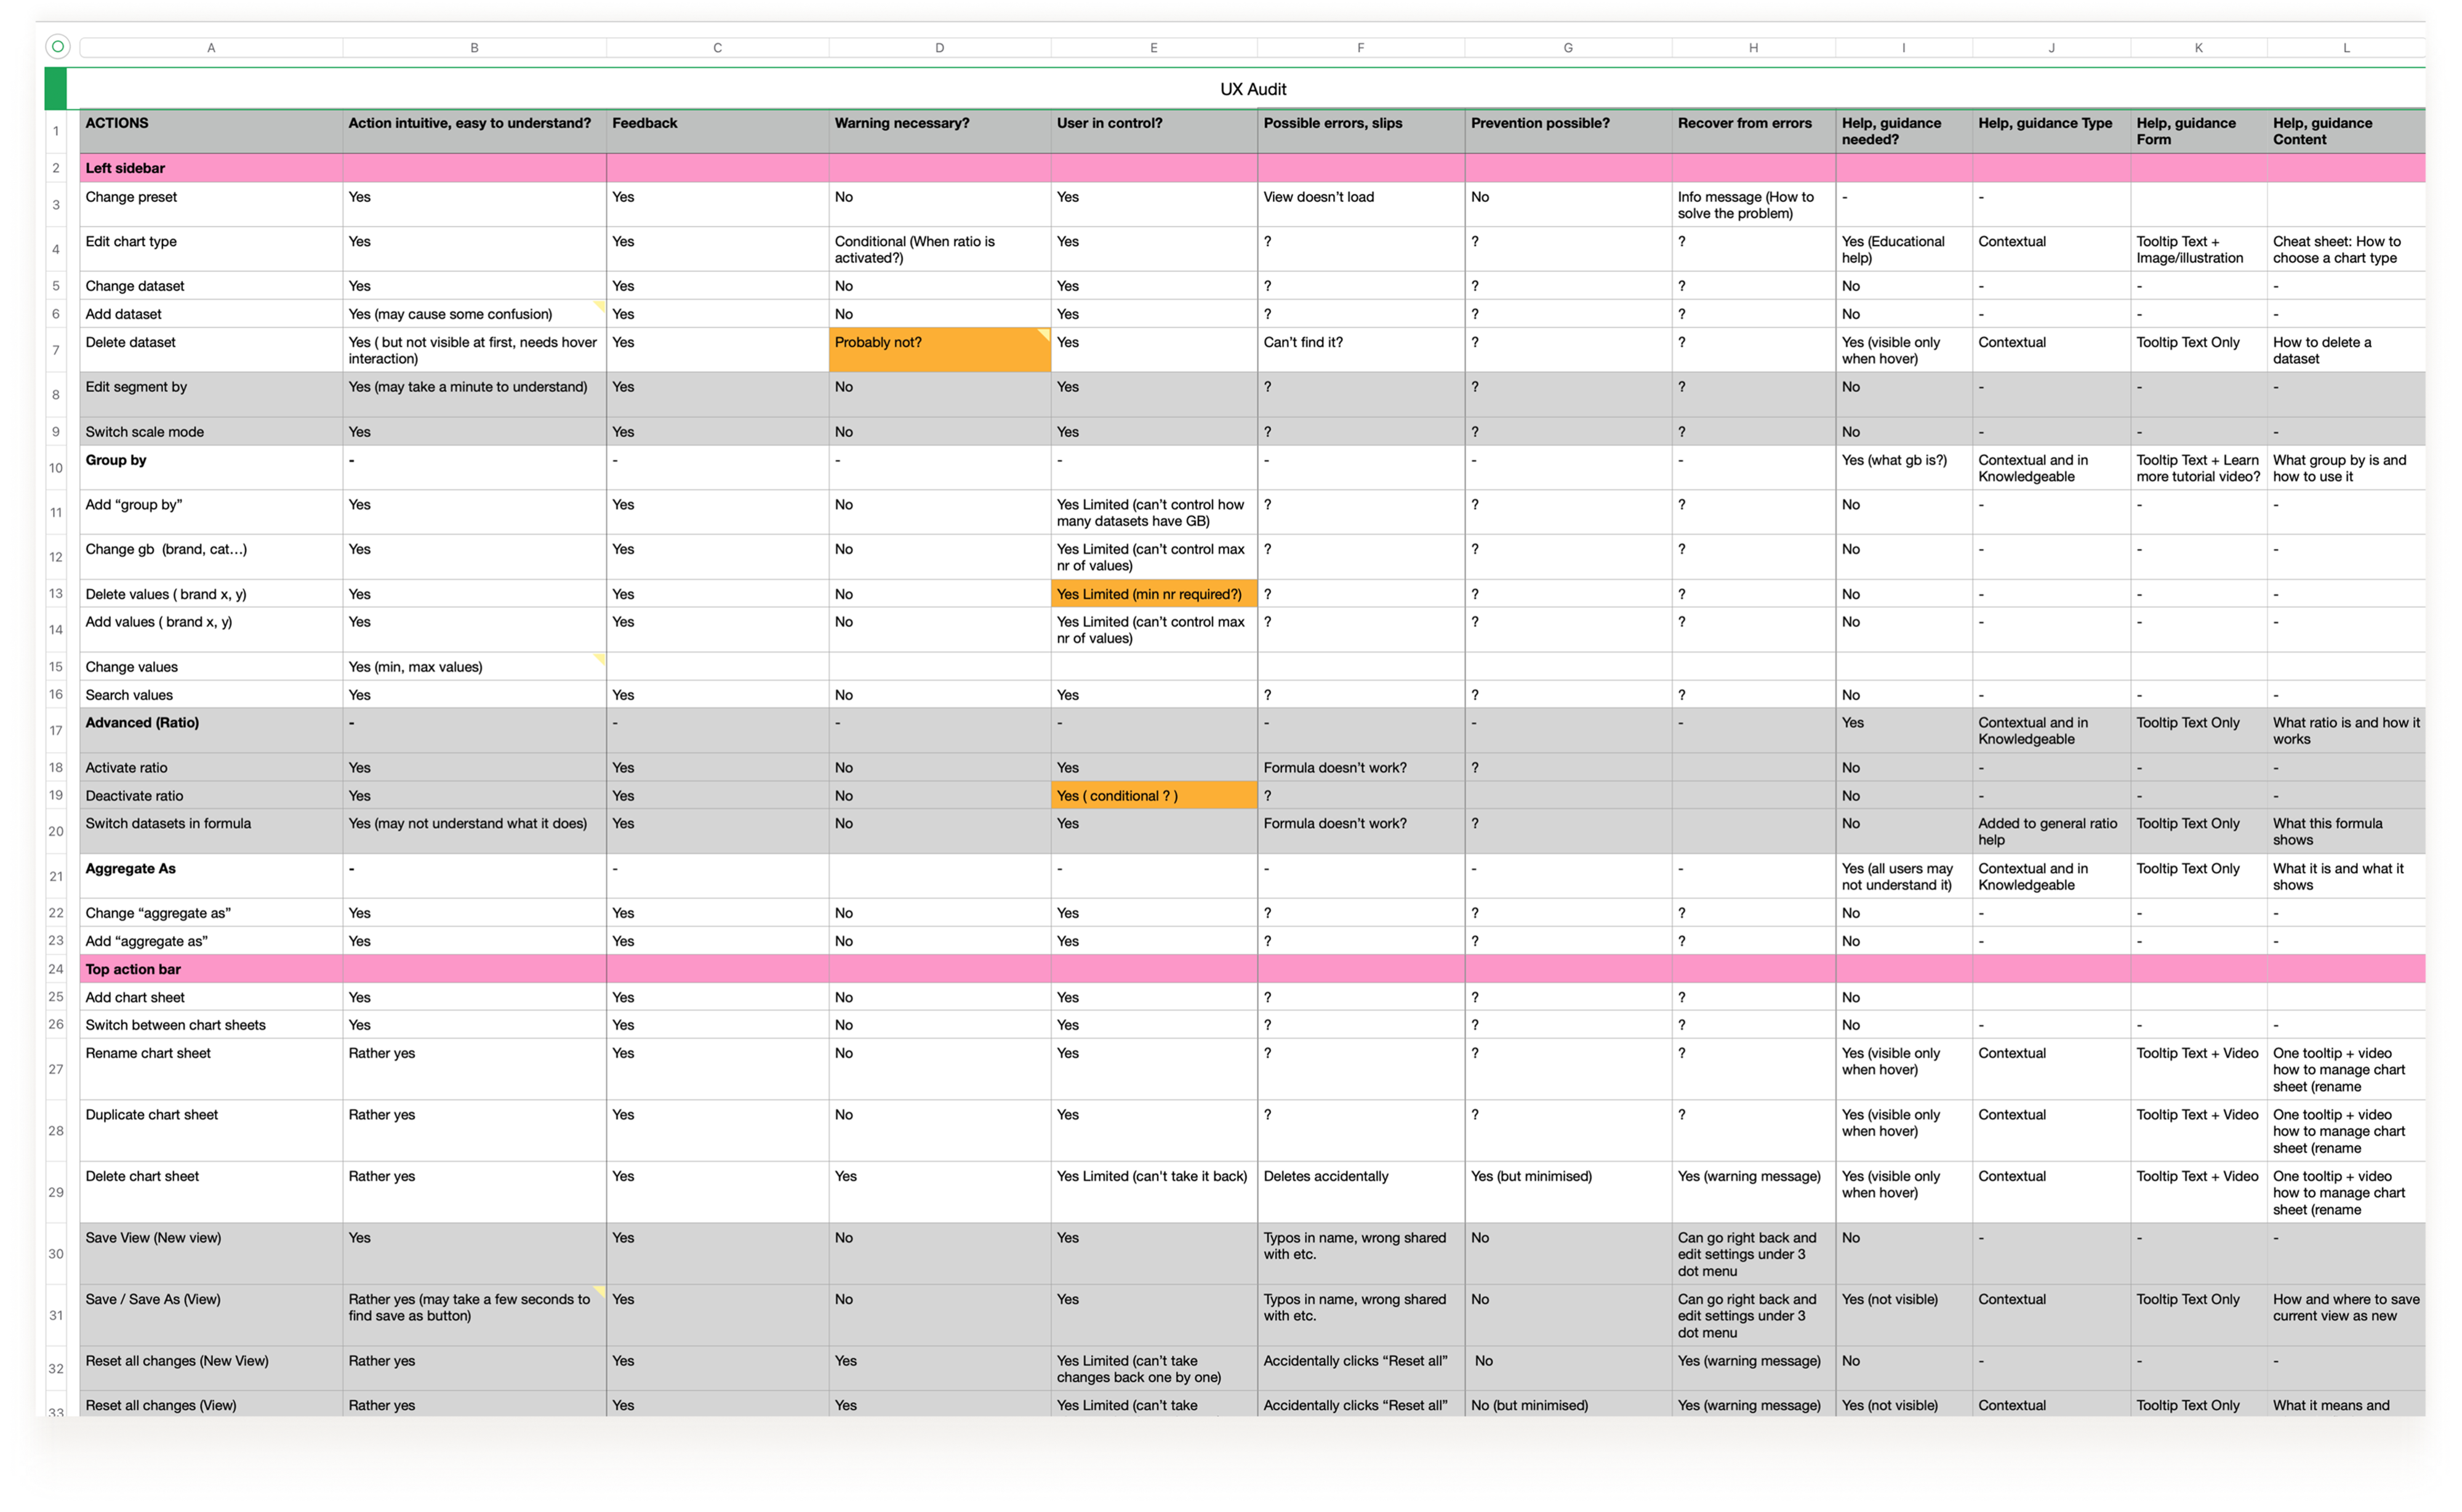
UX audit where all actions are validated through selected usability heuristics and through help “filters” that helped define the need for guidance.
Through an audit framework, I identified the touchpoints where users might need help, when they would need it, and what type of assistance would be most effective.
The final concept included both functional and educational guidance at different stages of product use. This combined external help, such as knowledge base articles, tutorials, and contextual guidance, with tooltips triggered by specific user actions within the product.
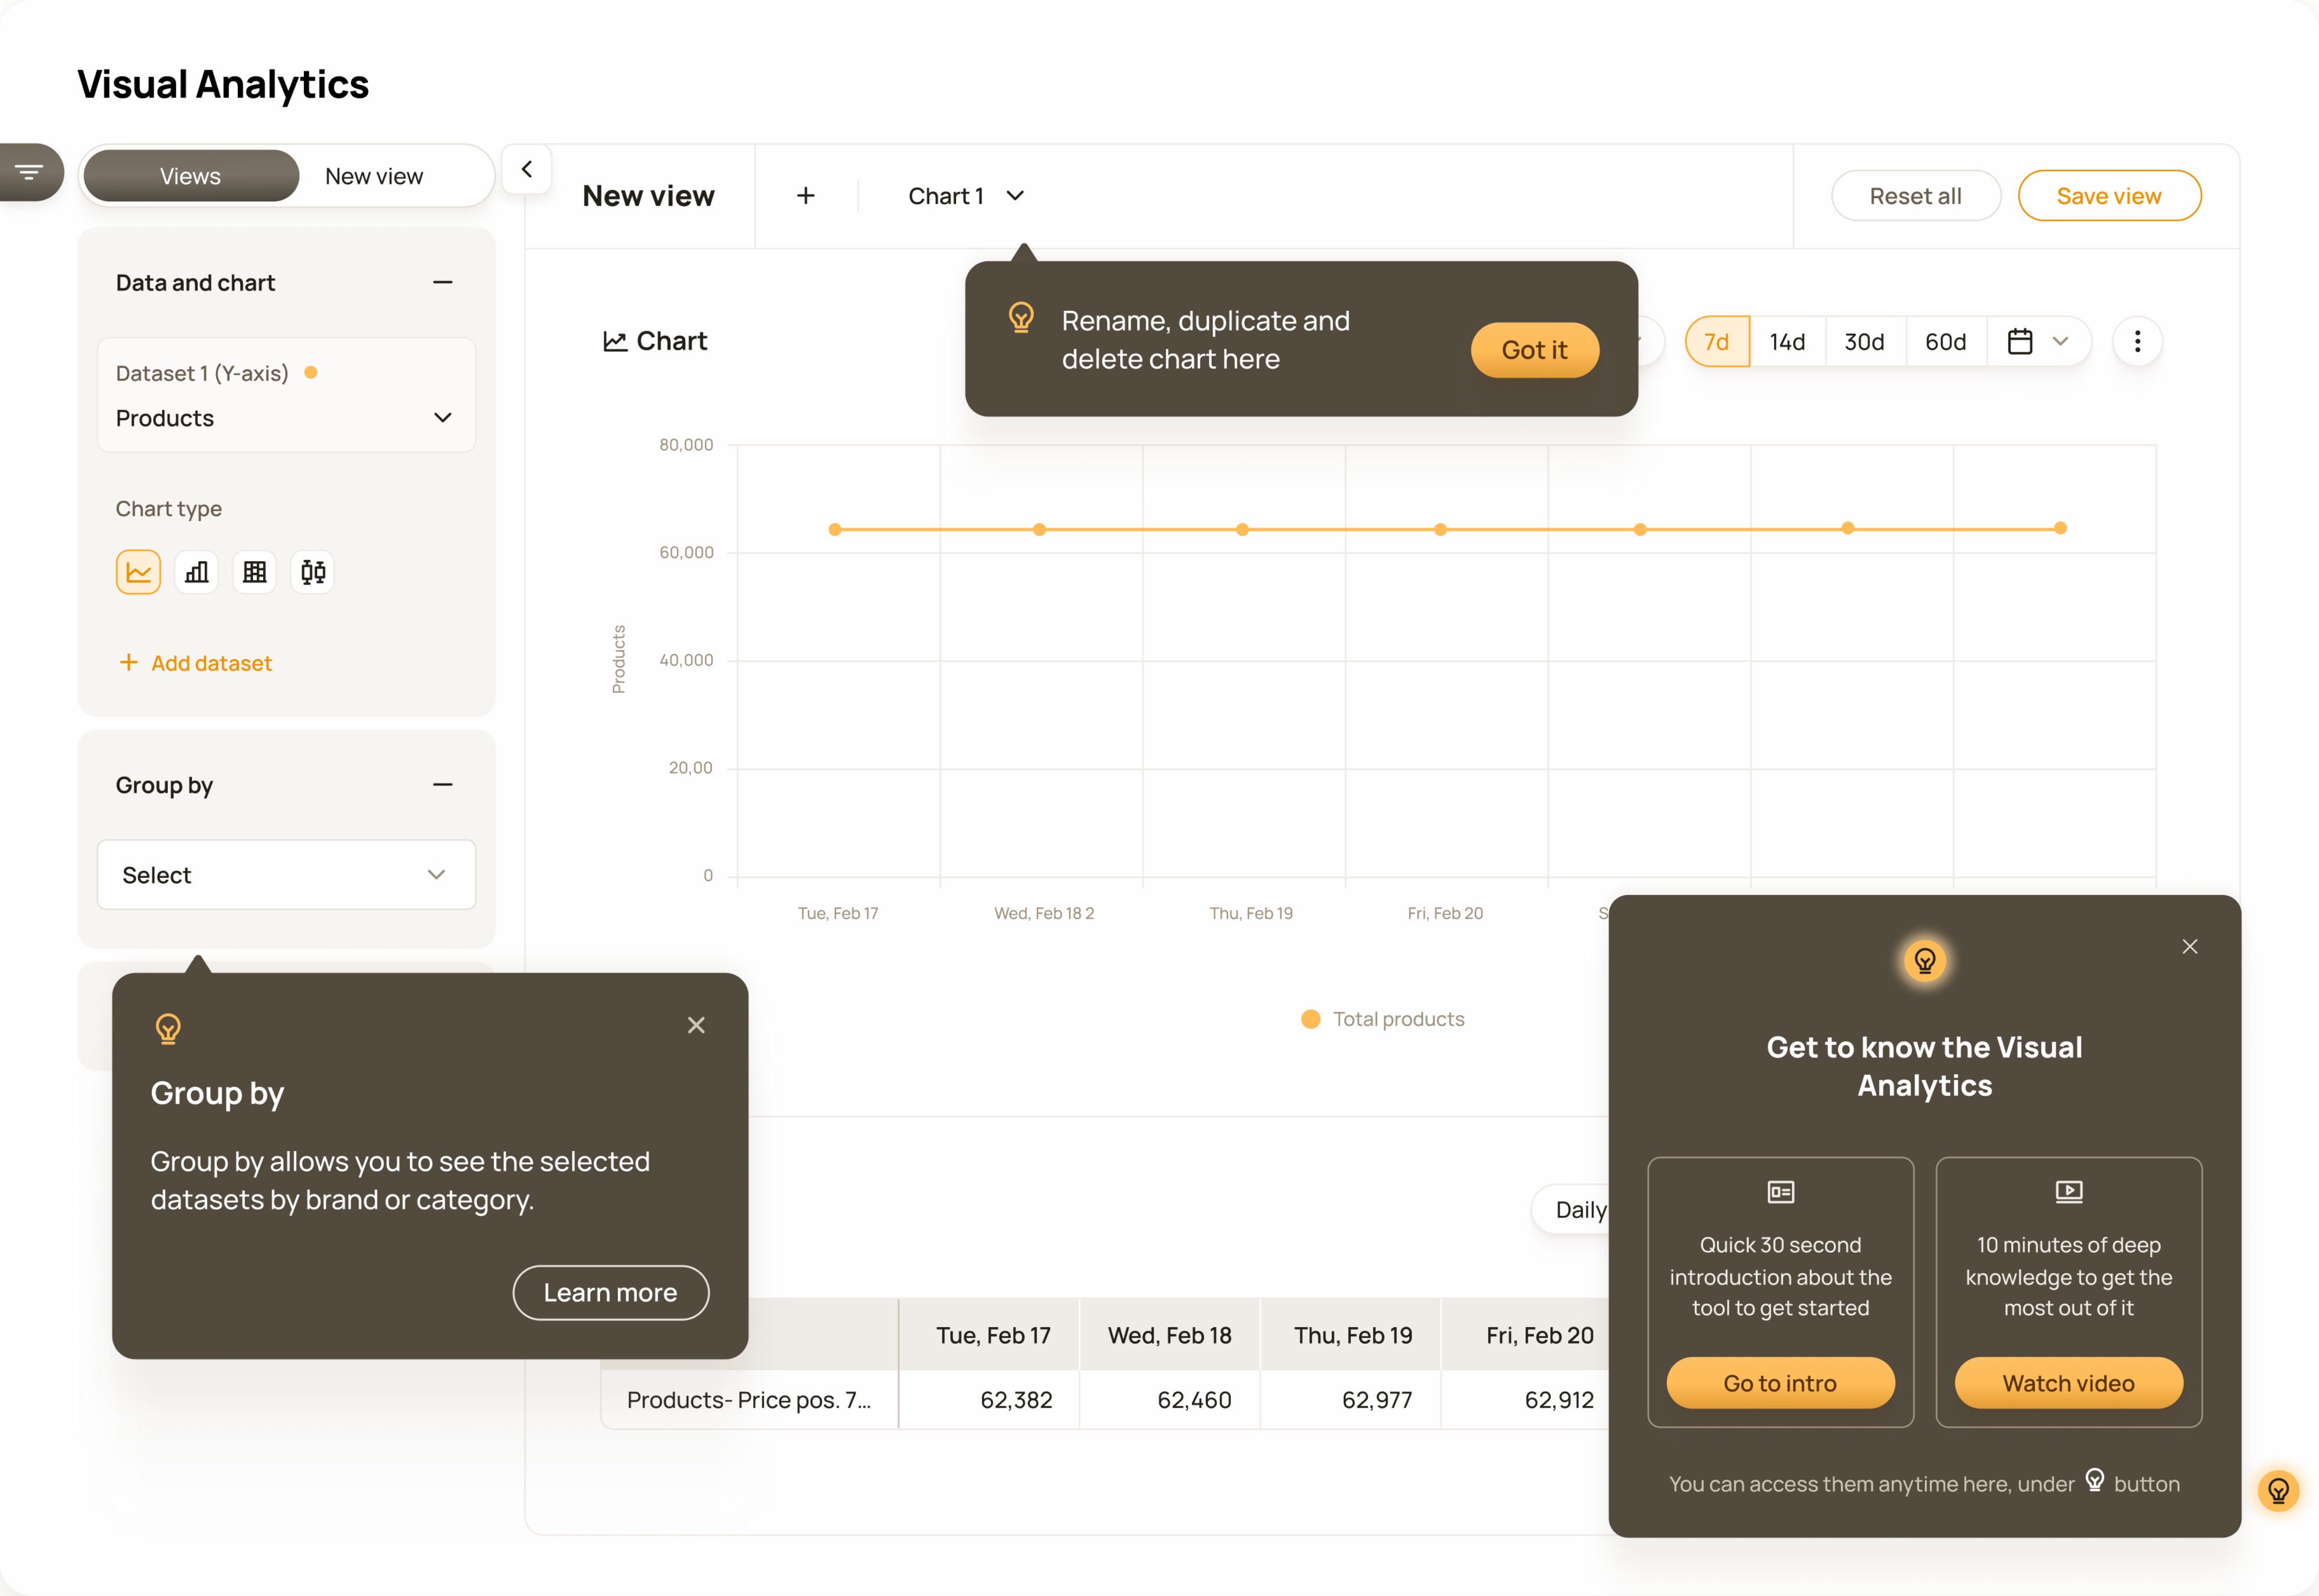
Guidance starts in the bottom-right corner with high-level functional and educational content, while contextual tooltips provide additional help during use.
Engagement with the tool was better than we expected, especially considering that it was a paid niche feature meant for larger customers.
35%
Feature discovery rate
“It seems to be very useful so far.”
Customer quote
20%
Total feature adoption rate
60%
Trial start rate
“Insightful. I find it clear and user-friendly.”
Customer feedback
Customers: 80+. Metrics have been anonymised, rounded and presented without a time frame to protect company confidentiality.
Product Strategy Officer
Product Owner
Engineers
Designer
As the sole designer I was responsible for the full design cycle, from conceptualisation to polished UI. I was working closely with the product, customer success and engineering to shape the solution within real technical and business constraints.